文章信息
- 齐明辉, 胡雪婷, 赵静, 李正, 刘明, 李刚
- QI Minghui, HU Xueting, ZHAO Jing, LI Zheng, LIU Ming, LI Gang
- 贝母混合品中川贝母含量近红外光谱检测方法优化
- Optimization of near infrared spectroscopy detection method for fritillaria cirrhosa content in fritillaria mixture
- 天津中医药大学学报, 2022, 41(6): 767-773
- Journal of Tianjin University of Traditional Chinese Medicine, 2022, 41(6): 767-773
- http://dx.doi.org/10.11656/j.issn.1673-9043.2022.06.17
-
文章历史
收稿日期: 2022-09-09
2. 省部共建组分中药国家重点实验室, 天津 301617;
3. 中国医学科学院生物医学工程研究所, 天津 300192;
4. 天津大学精密测试技术及仪器国家重点实验室, 天津 300072
2. State Key Laboratory of Components-based Chinese Medcine, Tianjin 301617, China;
3. Biomedical Engineering Institute, Chinese Academy of Medical Science, Tianjin 300192, China;
4. State Key Laboratory of Precision Measuring Technology and Instruments, Tianjin University, Tianjin 300072, China
贝母药材采自四川、浙江、新疆3个省份,共获取FC、FT、FP各6批。为避免贝母的含水量差异对研究造成影响,所有样品经过烘干至恒重,然后进行粉碎、混合处理。为提高模型的丰富性,避免单批样品导致模型的特异性,本研究将6批FC、FT、FP分别混合成3批,针对混合的纯品分别随机选出1种,将3种贝母组合,最终得到6种组合(A1、A2、A3、A4、A5、A6)。FC、FT、FP的混合比例如图 1所示,根据FC在混合品所占比例(0、0.2、0.4、0.6、0.8、1),将混合品分为6组,从group0到group5表示FC比例增大,从左到右FT比例减小,FP比例增大,其中编号19为FC纯品,因此共得到18×6+3=111例混合品样本。受到采购样品总量的限制,其中获得的2个混合品样本量较少,不能满足近红外光谱数据采集要求,因此用于后续实验的混合品样本共109例。

|
| 图 1 混合设计与分组方法 |
本研究采用Thermo Electron公司生产的Antaris Ⅱ FT-NIR System傅里叶变换近红外光谱仪获取样品的漫反射光谱。光谱波数范围为4 000 cm-1~10 000 cm-1。光谱采集过程中,温度始终保持在25 ℃左右,湿度在35%左右。
采集光谱前,基于DOE(Design of experiment)的正交试验设计对文献中常用的粒径大小、扫描次数、分辨率、增益4个参数进行优化组合。选择L9(34)正交表,3因素3水平的因素水平表如表 1所示。
采集9个实验条件下的贝母粉末样品近红外光谱。在光谱采集过程中,每个样品采集3次,取其平均光谱作为样品光谱,以进行下一步分析。
1.3 数据处理为消除颗粒分布不均匀和颗粒大小产生的散射现象,本研究采用多元散射校正(Multiplicative Scatter Correction,MSC)[17-18]进行数据预处理,从而去除散射影响。偏最小二乘回归(Partial Least Squares Regression,PLSR)是一种有用的多变量分析方法,广泛应用于自变量(X)与因变量(Y)之间具有大量共线性变量的数据。作为经典的线性回归模型,PLSR已被广泛用于解决农业、食品等领域的定量预测问题。PLSR结合了主成分分析和多元回归的特点。它提取了1组潜在因素,并尽可能解释了自变量和因变量之间的协方差,在处理共线性变量的数据中具有较大的优势,在处理共线性变量的数据中具有较大的优势。本研究利用PLSR对划分的数据集进行建模分析,并采用决定系数R2、预测集均方根误差(Root Mean Square Error of Prediction,RMSEP)以及F值对模型预测能力进行评价,F值计算公式如下所示,F值越大,表明模型的预测能力越好。本研究所有数据处理均使用Matlab R2018a软件完成。

|
图 2a、b、c、d分别为粒径大小、扫描次数、分辨率、增益四个研究因素对光谱的考察。研究通过针对同1个样本,改变其他3个因素,控制一个因素的方法,以考察单因素对样品光谱的影响。图 2a表明,粒径大小对样品光谱的吸光度有影响,随着粒径越小,吸光度呈现越小的现象。光谱信噪比大小与扫描次数有关,因此,本文对3水平下4 000~9 000 cm-1波数范围的样品光谱峰谷数量进行比较,以获得光谱平滑度,来评估不同扫描次数的光谱质量。其中,峰谷数量越多,说明光谱波动较大,毛刺较多,光谱质量低;峰谷数量越少,光谱越平滑,毛刺少,光谱质量高。图 2b为不同扫描次数峰谷数量的箱线图。图 2d直观地表达了不同扫描次数峰谷数量的差异,扫描次数少,峰谷数量多,说明光谱毛刺较多;随着扫描次数增多,峰谷数量减少,光谱越平滑,说明多次扫描平均,能够有效去除光谱中的部分噪声,但扫描次数并不是越多越好,多次测量平均虽然可以去除部分噪声,但是在去除噪声的同时,也可能去除了部分有用信号,导致仪器所产生的系统误差较大。因此选取最佳扫描次数提高后续定量模型的预测能力显得非常必要。分辨率反映了不同光程下的样品信息,增益为信号增强的程度,图 2c、d分别显示了不同水平分辨率与增益的样品光谱,右上角分别显示了不同水平分辨率与增益的光谱,从图中发现,不同水平分辨率和增益的光谱彼此重叠,吸光度没有明显差异。利用三维光谱图考察了不同水平分辨率和增益的光谱噪声,从图中发现,依据光谱噪声也不能选出最佳水平。因此,单因素考察不能得出有效结论。

|
| 注:a.粒径;b.扫描次数;c.分辨率;d.增益。 图 2 不同影响因素的光谱 |
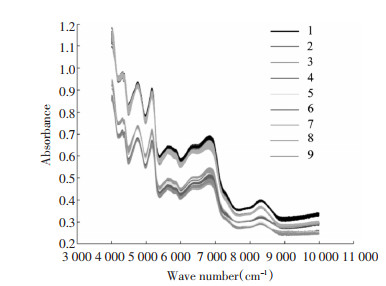
3种纯品贝母的光谱特征及九组不同因子水平组合下109例样本的平均近红外光谱曲线如图 3所示。

|
| 图 3 九种不同因子水平组合的MSC光谱 |
由图 3可见,9个组合下各光谱曲线的波形无明显差异,均存在6个吸收峰,分别位于4 200 cm-1、4 600 cm-1、5 600 cm-1、6 300 cm-1、6 900 cm-1、8 300 cm-1,这与C-H、O-H、N-H的伸缩与倍频振动相关[19]。进一步对九组不同因子水平光谱吸光度进行比较发现,各组间吸光度存在差异,但与文献中已证明的粒径越小,吸光度越小[20]结论不同,表明扫描次数、分辨率、增益对吸光度也有一定的影响,同时进一步证明参数之间相互影响,基于正交实验设计进行参数优化研究是有必要的。
2.3 正交实验结果由于模型性能涉及到多种指标,实验在保证模型未过拟合的情况下,综合考虑R2、RMSEP对建模效果及模型预测能力的影响,因此采用F值进行综合评价。基于PLSR模型的正交试验结果如表 2所示。其中R值反映了同一影响因素不同水平所建模型预测能力的模型差异,R值越大,表明同一因素不同水平的影响越显著。K值反映了同一影响因素对试验指标的影响,K值越大,该水平对应该因素的影响越大,K值最大是因素水平为该影响因素的优水平。
从表 2的极值R来看,RC>RA>RB>RD,由此可见影响贝母粉末样品中FC含量定量模型预测精度的主次因素为扫描次数>粒径>分辨率>增益。
严衍禄[22]提到:“扫描次数增加,相应模型的性能有所改善,这是因为扫描次数增加提高了光谱的信噪比,但不是扫描次数越多越好”。本研究中,C3为优水平,即扫描次数为64时,模型较好。进一步对正交试验K值结果进行比较,对于扫描次数,K1 < K2 < K3,表明扫描次数越大,模型越优,然而扫描次数与模型性能是否呈现线性还有待研究。
粒径大小反映了样品对光谱散射影响,有研究[20]表明粒径越小,光谱质量越高,本研究中过120目药典筛的样品粒径为该影响因素的优水平,其中K2 < K1 < K3,与已有结论存在差异,这可能是因为4个参数之间相互影响的结果。
傅里叶变换近红外光谱仪的分辨率与移动反光镜的移动距离有关[23],分辨率越高,波数点越多,光谱数据越丰富;对于对光谱有较强吸收的样品来说,可以获取样品更多光谱特征信息;对于吸收较弱的样品来说,造成光谱数据冗余,有效光谱数据比例降低,从而导致模型较差[24]。本研究将4 cm-1、8 cm-1、16 cm-1 3个水平的分辨率引入正交试验设计中,其中最佳模型对应的分辨率为介于3个水平的中间值,表明分辨率为8 cm-1时,川贝母及其掺假品有较好的吸收,同时避免了数据冗余对数据处理的影响。
系统信号的增强程度用增益表示,实验设置了2、4、8三个水平的增益,其中增益为8时,模型最佳。
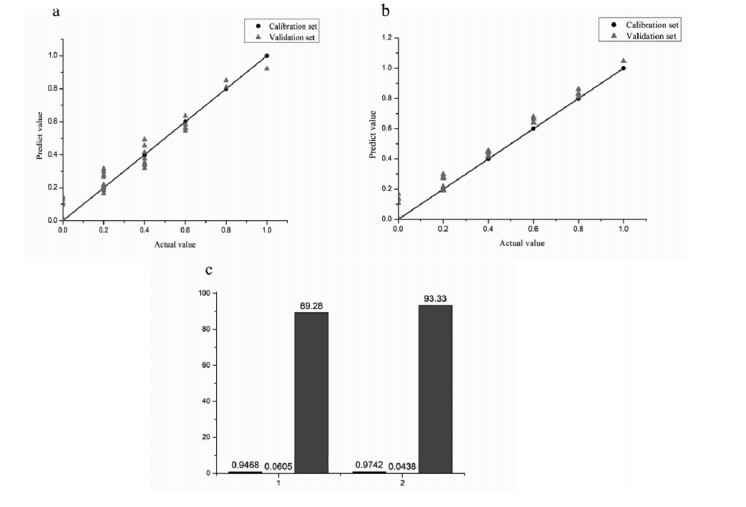
由表 2可见,九个不同参数组合下的F值范围为69.07-88.11。F值反映了不同因素的最优水平组合,F值越大,模型预测性能越好,因此正交实验设计的最佳组合是A3B2C3D1。K值反映了同一影响因素对实验指标的影响,K值越大,该水平对应该影响因素的优水平,因此四个影响因素的最佳优水平组合为A3B2C3D3。A3B2C3D3并没有出现于正交实验设计方案中。为了确定最优参数组合,分别对A3B2C3D1、A3B2C3D3两种参数组合下获得的模型预测结果进行比较。图 4a、b为A3B2C3D1、A3B2C3D3对应的PLSR模型预测结果。图 4c为两参数组合所建模型性能指标参数。其中数值1代表A3B2C3D1参数组合,2代表A3B2C3D3参数组合。图 4c直观地反映了A3B2C3D3的模型预测性能整体优于A3B2C3D1。结果表明,A3B2C3D3即粒径为过120目药典筛、扫描次数为64、分辨率为8,增益为8,此时建模结果为:Rp2=0.9742,RMSEP=0.0438,F=93.33。

|
| 图 4 不同参数组合PLSR模型预测结果 |
由上述实验结果可见,合理的参数设计可以最大程度地提高模型的可靠性和预测能力。扫描次数、粒径大小、分辨率以及增益4个因素对模型预测精度均有一定的影响,正交实验设计可以综合考虑各因素的共同影响,获取最优参数组合。
3 总结近红外光谱检测参数的选择直接影响模型的预测能力。本研究以市面上常见的FC中掺入FT和FP的贝母样品为例,对贝母粉末中FC含量的近红外光谱定量检测条件进行优化,为避免对模型单因素影响研究的局限性,本研究通过正交实验设计综合评价粒径大小、扫描次数、分辨率、增益多因素对模型的共同影响。实验结果表明,4个参数均会给贝母粉末近红外光谱定量分析模型精度带来影响。并且贝母粉末粒径大小为120目,扫描次数为64,分辨率为8,以及增益为8时,可以建立最优模型,获得最佳的检测结果。该方法综合考虑了近红外光谱数据采集中的4个重要参数的不同水平组合,有效的避免了单因素研究的局限性,本研究为制药企业中贝母粉末样品近红外光谱质量检测参数优化提供了借鉴。
| [1] |
LI Y B, ZHANG L, WU H Y, et al. Metabolomic study to discriminate the different Bulbus fritillariae species using rapid resolution liquid chromatography-quadrupole time-offlight mass spectrometry coupled with multivariate statistical analysis[J]. Analytical Methods, 2014, 6(7): 2247-2259. DOI:10.1039/c3ay41928b |
| [2] |
WANG Z, XIE H Y, REN J, et al. Metabolomic approach for rapid differentiation of Fritillaria bulbs by matrix-assisted laser desorption/ionization mass spectrometry and multivariate statistical analysis[J]. Journal of Pharmaceutical and Biomedical Analysis, 2020, 185(8): 113177. |
| [3] |
YANG S, XIE S, XU M, et al. A novel method for rapid discrimination of bulbus of Fritillaria by using electronic nose and electronic tongue technology[J]. Analytical Methods, 2015, 7(3): 943-952. DOI:10.1039/C4AY02230K |
| [4] |
XU Y, MING T W, GAUN T K W, et al. A comparative assessment of acute oral toxicity and traditional pharmacological activities between extracts of Fritillaria cirrhosae Bulbus and Fritillaria pallidiflora Bulbus[J]. Journal of Ethnopharmacology, 2019, 238(14): 111853. |
| [5] |
XIN G Z, LAM Y C, MAIWULANJIANG M, et al. Authentication of Bulbus fritillariae cirrhosae by RAPD-derived DNA markers[J]. Molecules (Basel, Switzerland), 2014, 19(3): 3450-3459. DOI:10.3390/molecules19033450 |
| [6] |
MOHAMMAT A, YILI A, AISA H A. Rapid quantification and quantitation of alkaloids in Xinjiang Fritillaria by ultra performance liquid chromatography-quadrupole time-offlight mass spectrometry[J]. Molecules (Basel, Switzerland), 2017, 22(5): 719. DOI:10.3390/molecules22050719 |
| [7] |
ZHOU J L, XIN G Z, SHI Z Q, et al. Characterization and identification of steroidal alkaloids in Fritillaria species using liquid chromatography coupled with electrospray ionization quadrupole time-of-flight tandem mass spectrometry[J]. Journal of Chromatography A, 2010, 1217(45): 7109-7122. DOI:10.1016/j.chroma.2010.09.019 |
| [8] |
LIU F J, JIANG Y, LI P, et al. Untargeted metabolomics coupled with chemometric analysis reveals species-specific steroidal alkaloids for the authentication of medicinal Fritillariae Bulbus and relevant products[J]. Journal of Chromatography A, 2020, 1612(12): 460630. |
| [9] |
LUO D D, LIU Y Y, WANG Y P, et al. Rapid identification of Fritillariae Cirrhosae Bulbus and its adulterants by UPLC-ELSD fingerprint combined with chemometrics methods[J]. Biochemical Systematics and Ecology, 2018, 76(7): 46-51. |
| [10] |
SMITH-MORITZ A M, CHERN M, LAO J, et al. Combining multivariate analysis and monosaccharide composition modeling to identify plant cell wall variations by fourier transform near infrared spectroscopy[J]. Plant Methods, 2011, 7(2): 26. |
| [11] |
MAHESH S, JAYAS D S, PALIWAL J, et al. Comparison of partial least squares regression(PLSR) and principal components regression (PCR) methods for protein and hardness predictions using the near-infrared (NIR) hyperspectral images of bulk samples of Canadian wheat[J]. Food and Bioprocess Technology, 2015, 8(1): 31-40. DOI:10.1007/s11947-014-1381-z |
| [12] |
YIN W X, ZHANG C, ZHU H Y, et al. Application of nearinfrared hyperspectral imaging to discriminate different geographical origins of Chinese wolfberries[J]. PLoS One, 2017, 12(7): e0180534. DOI:10.1371/journal.pone.0180534 |
| [13] |
CHEN J B, WANG Y, LIU A X, et al. Two-dimensional correlation spectroscopy reveals the underlying compositions for FT-NIR identification of the medicinal bulbs of the genus Fritillaria[J]. Journal of Molecular Structure, 2018, 1155(11): 681-686. |
| [14] |
赵耀东, 杜伟锋, 王胜波, 等. 基于近红外光谱的浙贝母中贝母素甲和贝母素乙含量快速检测方法的建立[J]. 中华中医药学刊, 2013, 31(4): 756-758. ZHAO Y D, DU W F, WANG S B, et al. Rapid detection of peimine and peininine in Bulbus fritillariae thunbergii by near infrared spectroscopy[J]. Chinese Archives of Traditional Chinese Medicine, 2013, 31(4): 756-758. |
| [15] |
MENG Y, WANG S S, CAI R, et al. Discrimination and content analysis of Fritillaria using near infrared spectroscopy[J]. Journal of Analytical Methods in Chemistry, 2015, 2015(12): 752162. |
| [16] |
邓波, 周玉荣, 刘志宏, 等. FT-NIR与主成分分析在中药贝母鉴别和聚类中的应用研究[J]. 光谱实验室, 2006, 23(5): 1103-1106. DENG B, ZHOU Y R, LIU Z H, et al. Study of application of FT-NIR and principal component analysis to the classing and distinguishing of Fritillaria[J]. Chinese Journal of Spectroscopy Laboratory, 2006, 23(5): 1103-1106. DOI:10.3969/j.issn.1004-8138.2006.05.056 |
| [17] |
MISHRA P, BIANCOLILLO A, ROGER J M, et al. New data preprocessing trends based on ensemble of multiple preprocessing techniques[J]. TrAC Trends in Analytical Chemistry, 2020, 132(11): 116045. |
| [18] |
MISHRA P, VERKLEIJ T, KLONT R. Improved prediction of minced pork meat chemical properties with near-infrared spectroscopy by a fusion of scatter-correction techniques[J]. Infrared Physics & Technology, 2021, 113(6): 103643. |
| [19] |
BEĆ K B, FUTAMI Y, WÓJCIK M J, et al. A spectroscopic and theoretical study in the near-infrared region of low concentration aliphatic alcohols[J]. Physical Chemistry Chemical Physics: PCCP, 2016, 18(19): 13666-13682. DOI:10.1039/C6CP00924G |
| [20] |
倪力军, 张立国, 张强祖. 标准方差概念在光谱分析中的应用[J]. 化工高等教育, 2012, 29(2): 97-99, 108. NI L J, ZHANG L G, ZHANG Q Z. Application of standard variance concept in spectral analysis[J]. Higher Education in Chemical Engineering, 2012, 29(2): 97-99, 108. |
| [21] |
彭丹, 刘亚丽, 李林青, 等. 正交试验设计优化近红外检测牛乳中蛋白质的建模条件[J]. 食品科学, 2020, 41(4): 256-261. PENG D, LIU Y L, LI L Q, et al. Optimization of modeling conditions for near infrared measurement of protein content in milk by orthogonal array design[J]. Food Science, 2020, 41(4): 256-261. |
| [22] |
严衍禄. 近红外光谱分析基础与应用[M]. 北京: 中国轻工业出版社, 2005. YAN Y L. Fundamentals and application of near infrared spectroscopy[M]. Beijing: China Light Industry Press, 2005. |
| [23] |
褚小立. 近红外光谱分析技术实用手册[M]. 北京: 机械工业出版社, 2016. CHU X L. Practical manual of near infrared spectroscopy analysis technology[M]. Beijing: China Machine Press, 2016. |
| [24] |
江东晓. 不同光程及分辨率的甘蔗清汁锤度的FT-NIR分析模型研究[D]. 广州: 暨南大学, 2019. JIANG D X. Model research for FT-NIR analysis of sugarcane juice Brix with different pathlength and resolutions[D]. Guangzhou: Jinan University, 2019. |
 2022, Vol. 41


